A state of the art Inveon Dedicated PET scanner from Siemens with a high-resolution of 1.4 mm is available for small animal studies. It can do whole body imaging of rodents, rabbits and other small animals. The facility is equipped to carry out detailed in vivo and ex vivo studies of various biomarkers. Some examples are shown below:
I. 18F-FLUORO-2-DEOXYGLUCOSE (FDG)_GLUCOSE METABOLIC STUDIES
18F-Fluoro-2-deoxyglucose_Whole Body Rat
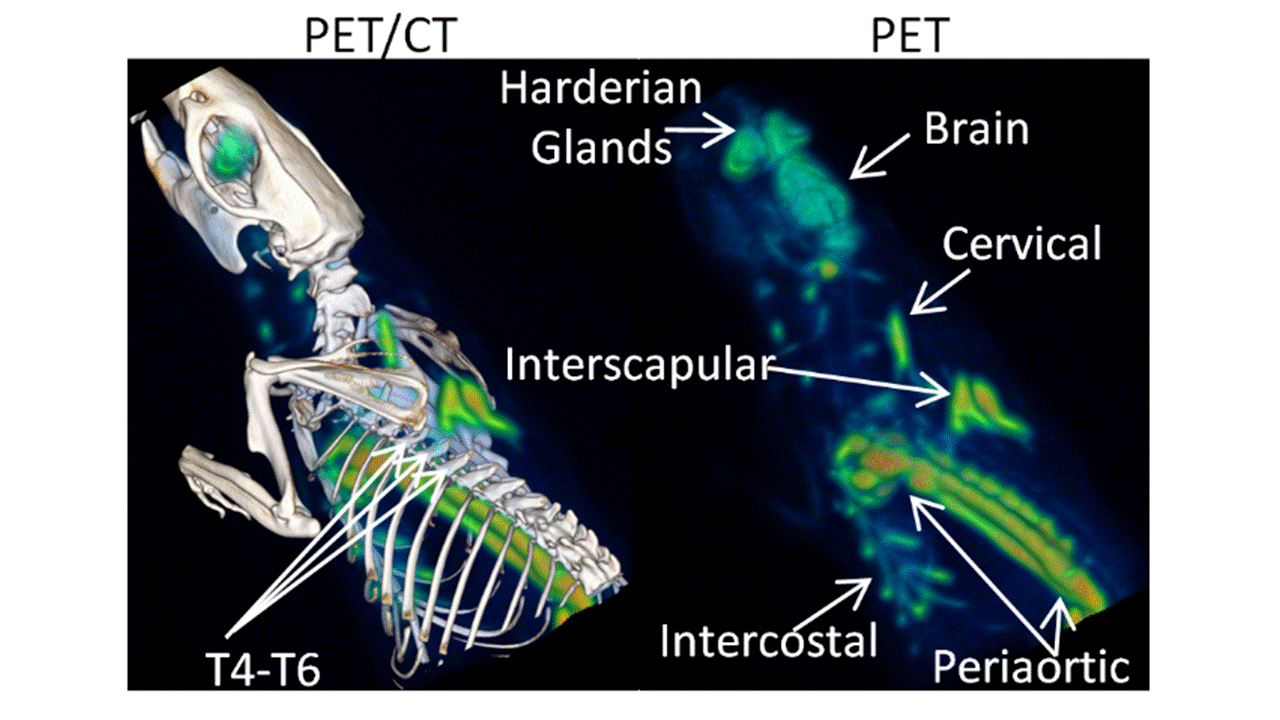
Views of PET/CT images show intense 18F-FDG uptake in the CL316,243 a beta3-adrenergic receptor agonist-activated brown adipose tissue (BAT). Three dimensional analysis of PET (right) and PET/CT (left) images showing interscapular, cervical, periaortic and intercoastal BATs.
18F-Fluoro-2-deoxyglucose_Rat Brain

Rat brain showing 18F-FDG in vivo from PET scan on the left. The middle image is after the whole brain is excised and a PET scan obtained. The right image is an autoradiograph after slicing the ex vivo brain.
18F-Fluoro-2-deoxyglucose_Whole Body Mouse

Mouse 18F-FDG_ A: 3-D analysis of PET (left) and PET/CT (middle) images clearly showing (a) cervical, (b) interscapular, (c) intercostals, (d) periaortic, and (e) perirenal BATs in rat. B: 3-D PET images of IBAT in mice: ventral, lateral, and dorsal views.
18F-Fluoro-2-deoxyglucose_New Zealand Rabbits Atherosclerotic model

II. DOPAMINE RECEPTOR STUDIES
18F-Fallypride_Dopamine D2/D3 Receptors_Rat Brain

Representative coronal, sagital and horizontal sections of a rat brain showing [18F]fallypride fused with the MR image template. VOI placement on dorsal striatum (DSTR), ventral striatum (VSTR), substantia nigra and ventral tegmental area (SN\VTA), superior and inferior colliculi (COL), central gray (CG) and cerebellum (CER).
18F-Dopamine Agonists_Rat Brain

In Vivo Rat PET with 18F-7-OH-FHXPAT. Normal male Sprague-Dawley rats injected intravenously with 7 MBq of 18F-7-OH-FHXPAT. Summed PET images were coregistered with rat MRI template. (A-C). MR sections, coronal (A), saggital (B) and horizontal (C) showing dorsal striatum (DSt), ventral striatum (VSt; cross hairs) and cerebellum (CB). (D-F). PET image slices corresponding to MR slices; coronal (D), sagittal (E), and horizontal (F) showing binding of 18F-7-OH-FHXPAT in DSt and VSt. (G-I). Corresponding coregistered PET-MR images showing binding of 18F-7-OH-FHXPAT in DSt and VSt and little in CB.
124I-Epidepride_ Extended imaging of dopamine receptors for Pancreas
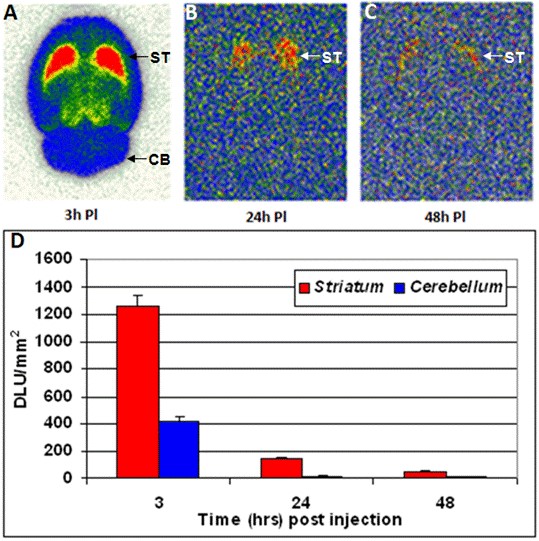
Ex vivo brain slice autoradiography results for epidepride uptake after A) 3 hours, B) 24 hours and C) 48 hours postinjection of 124I-epidepride (after IV injection of 0.1-0.15 mCi at specific activity of 100 Ci/mmol in a normal rat under 3% isoflurane) showing binding in the striatum (ST) and nonspecific binding in the cerebellum (CB). The plot D) shows the comparison of 124I-epidepride uptake in rat striatum and cerebellum at the different time points.
III. SEROTONIN RECEPTOR STUDIES
18F-Mefway_Serotonin 5HT1A Receptors_Rat Brain

(A). In vivo PET rat brain slice of [18F]mefway coregistered to MR template after injection of 24.6 ± 11.3 MBq dose of [18F]mefway. (B). Ex vivo PET of [18F]mefway taken immediately after completion of the in vivo PET scan. (C). After the ex vivo scan is completed, the brain is cut into 40 micron sections and exposed to phosphor screens.
IV. NICOTINIC RECEPTOR STUDIES
18F-Nifene_Nicotinic Acetylcholinergic a4b2 Receptors_Rat Brain

In vivo summed MicroPET rat brain slices (A: Horizontal; B. Sagittal; C: Coronal) of 18F-nifene. Thalamus (TH) shows highest binding followed by cortex (COR) and cerebellum (CB). Test /retest study showing consistency in binding of 18F-Nifene to the thalamus with respect to the cerebellum.
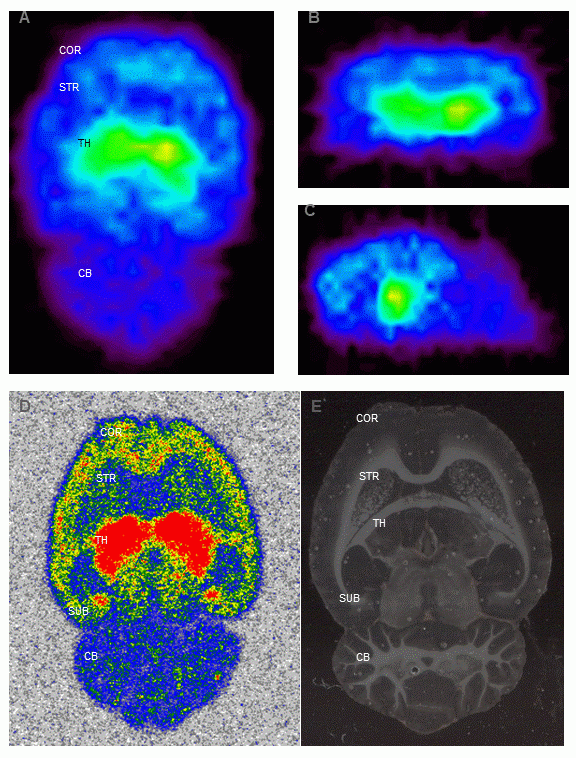
Ex Vivo MicroPET brain 18F-Nifene images of a rat sacrificed 60 minutes. MicroPET images ((A) horizontal (B) coronal and (C) sagittal) validate maximum binding in the thalamus (TH) followed by cortical regions (COR). Autoradiograph of brain in (A) showing 10µm horizontal sections (D) and a anatomical view (E) of slice in (D). 18F-Nifene binding followed the order TH > subiculum (SUB) > cortex (COR) > striatum (STR) > cerebellum (CE).
18F-NIFENE_Whole body Mouse dynamic PET imaging
18F-Nifene injected into the tail vein of the mouse. Movie shows movement of 18F-Nifene throughout the body and retention in the thalamus in the brain due to binding to nicotinic receptors.
18F-NIFENE_Coronal Mouse Brain dynamic PET imaging
18F-Nifene binding in the thalamus of the mouse brain seen in a dynamic PET scan.
V. HISTONE DEACETYLASE STUDIES
18F-FAHA_Histone Deacetylase (HDAC)_Rat Brain

18F-FAHA binding in Control A/J Mice. (A). Whole body PET in control mouse displays high 18F-FAHA uptake in the brain and kidneys. (B). Whole body PET in SAHA pre-injected mouse shows only in the kidneys with no uptake in the brain. (C-E). PET/CT of A/J mice head showing high uptake in the brain indicated in yellow regions (VS: ventral striatum; HY: hypothalamus; CB: cerebellum; BS: brain stem; FC: frontal cortex). (F-H). Little uptake in the brain is shown in SAHA pre-injected mouse
VI. RADIOLABELED ANTIBODY STUDIES
89Zr-Klotho monoclonal antibody_mice kidney imaging

Alpha-Klotho is a single-pass membrane protein primarily expressed by the kidneys. Klotho deficiency in chronic kidney disease (CKD) has been implicated in accelerated aging. PET/CT image below is of a control mouse injected with [89Zr]DFO-anti-mKlotho. The 30 minute static scan was taken 48 hours after injection and localized greater uptake in the bilateral kidney cortex is observed.